Bold Penguin SDK Debugging
Inspecting properties on Bold Penguin SDK components
You can inspect the current properties of a Bold Penguin SDK element, or or one of your custom element implementations, using web development tools and targeting the DOM element in the Elements panel.
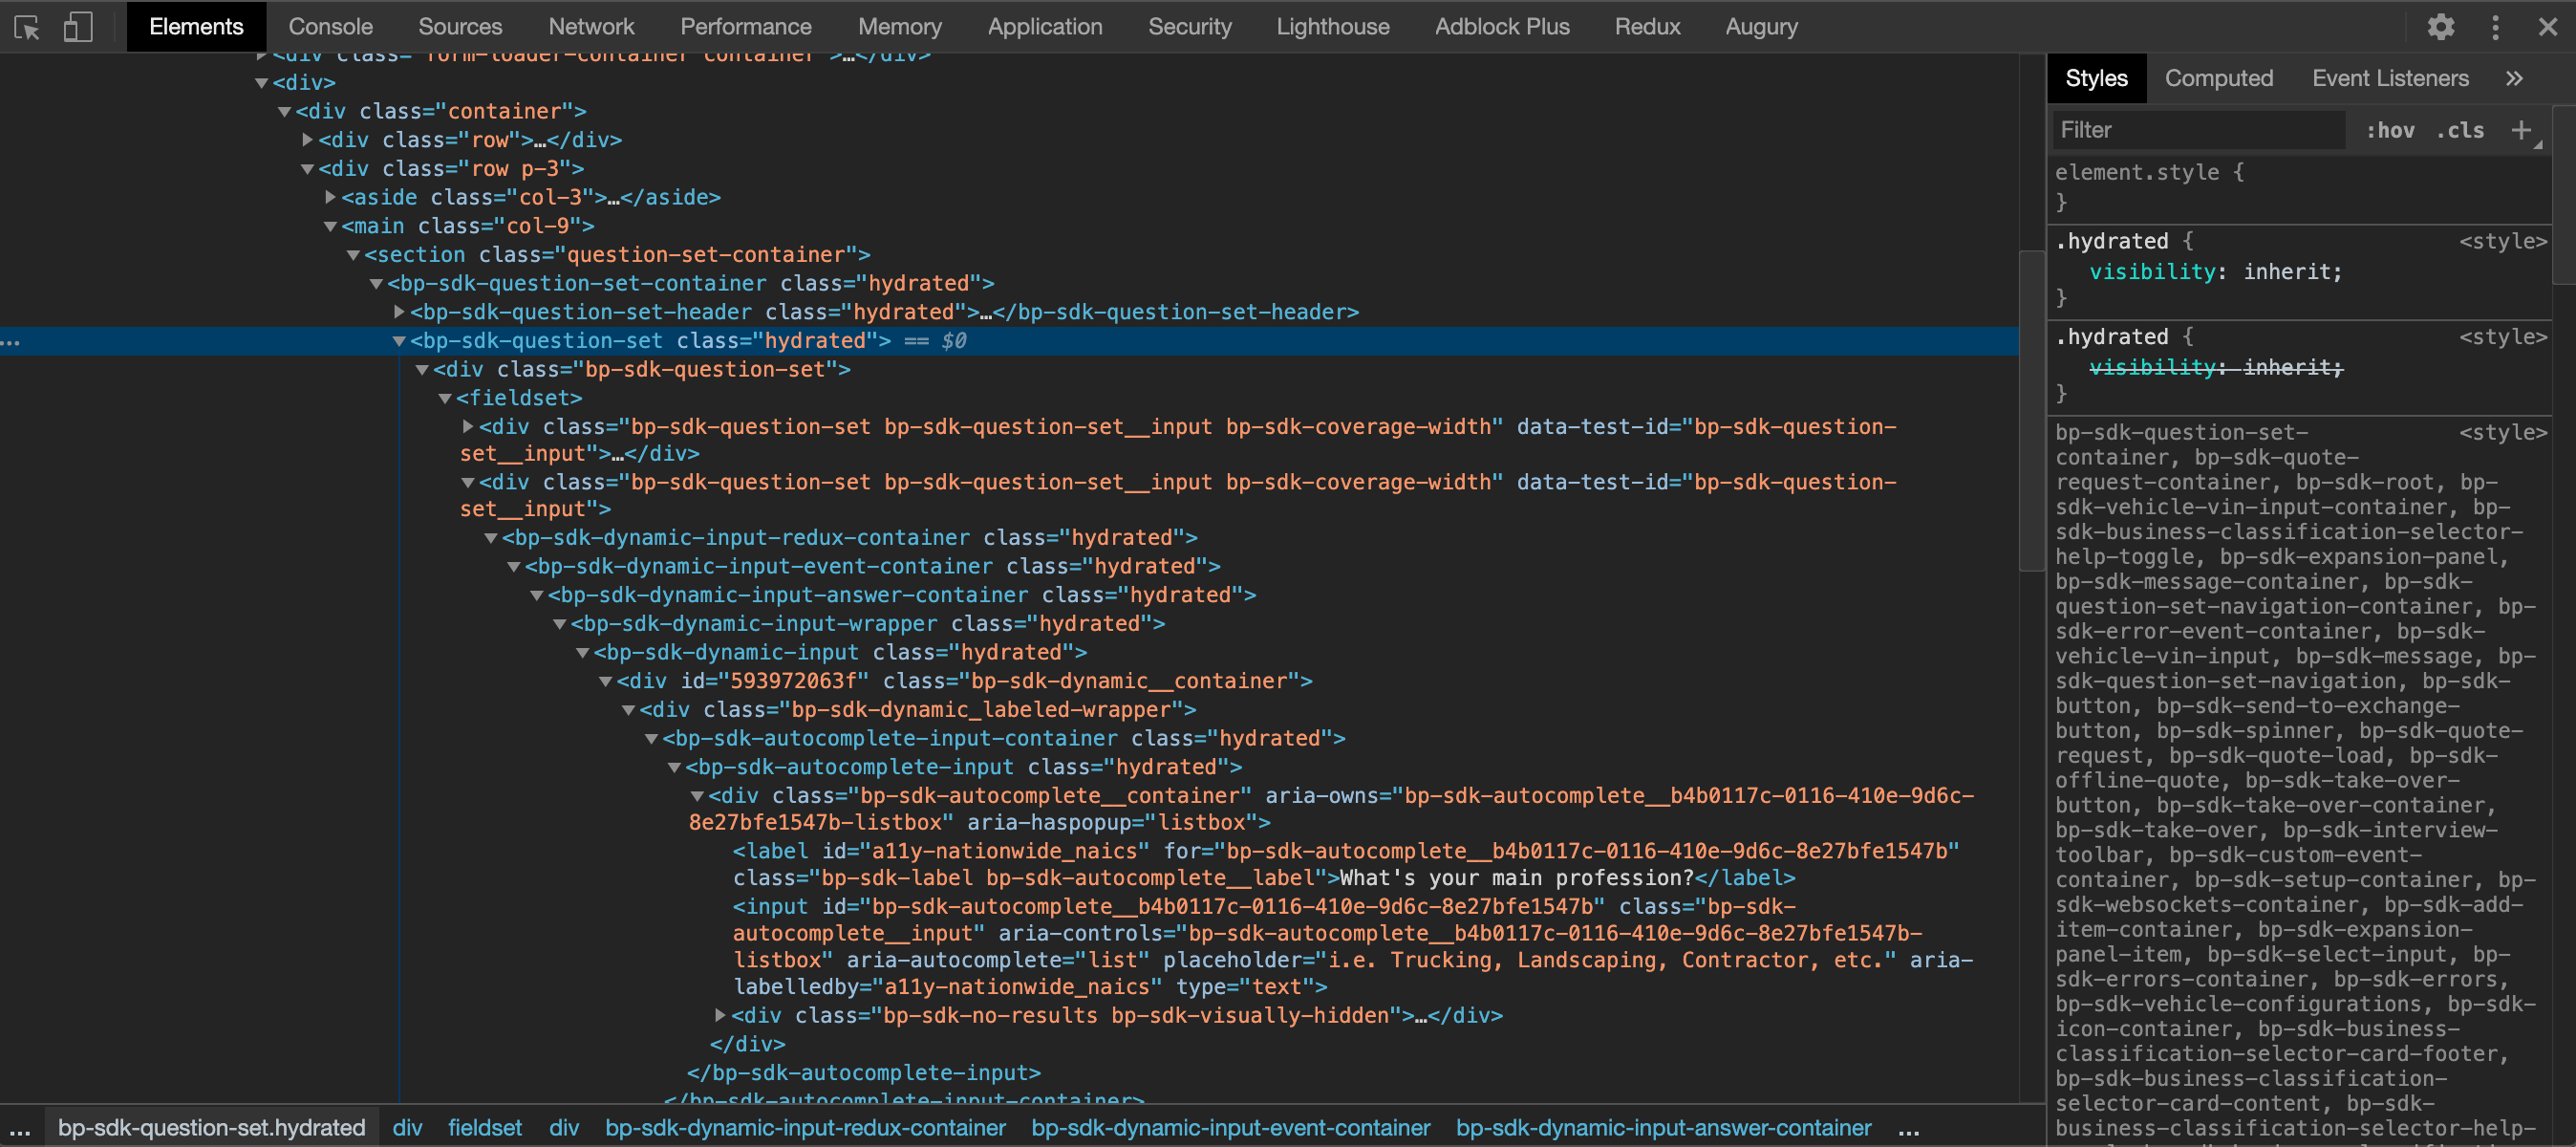
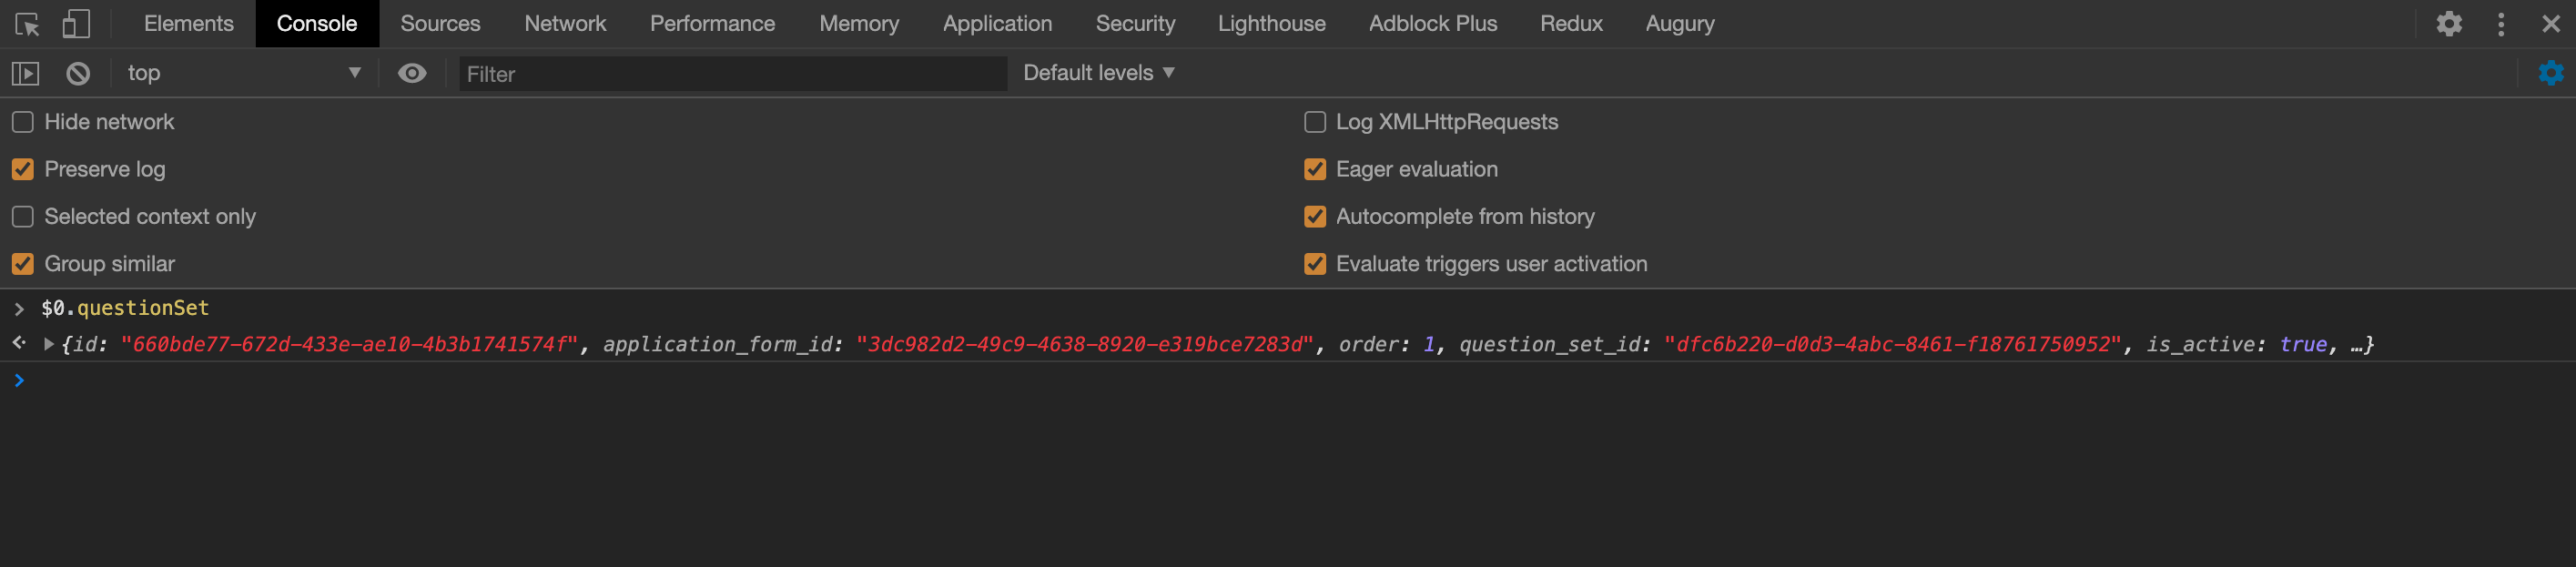
You can then switch over to console and use the $0 variable to inspect the properties.
Debug Flag
When initializing the Bold Penguin SDK, you may pass a debug flag which will output some additional information to the browser console as shown below.
import { init } from "@boldpenguin/sdk";
init({
  clientId: environment.clientId,
  env: environment.environmentFlag,
  googleApiToken: environment.googleApiToken,
  debug: true,
});
This will output all of the Redux actions and the outcome of the state changes as they are dispatched, and will send some Bold Penguin SDK specific error information to window.console.error where you can see the outcome of the Redux state changing in real time.
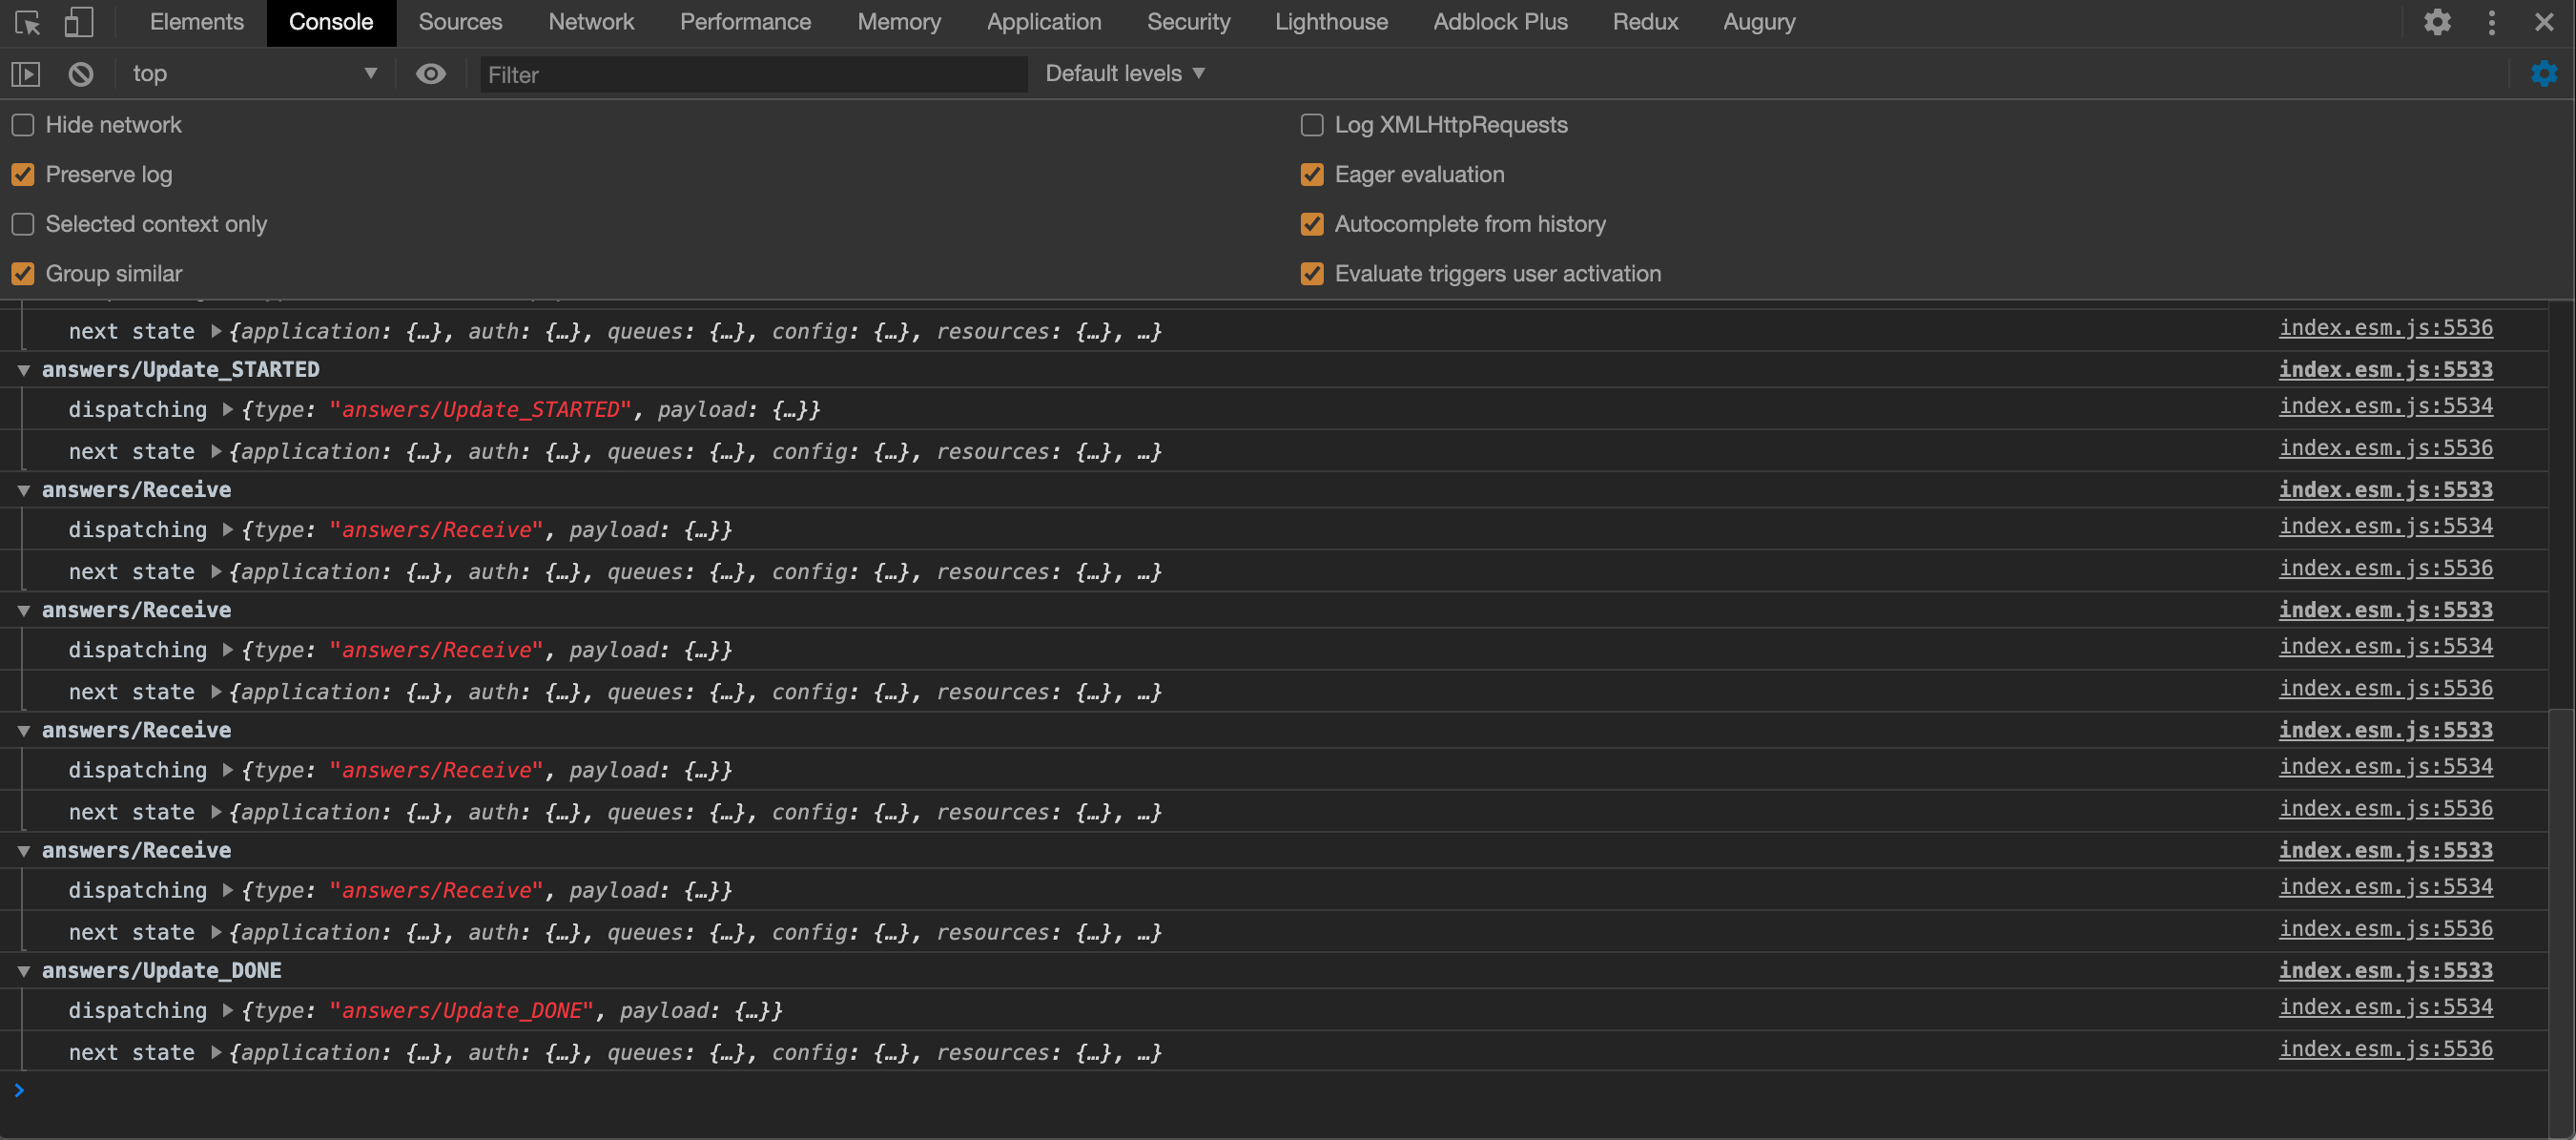 Screenshot showing Chrome Developer Tools Console panel open and redux actions being dispatched